
Jun 19, 2019
Nah. No Blur Anymore.

Jun 19, 2019
Nah. No Blur Anymore.
Jot down ideas directly on topics and flow with what’s going on in mind is exciting yet efficient. But once the words are overload, it would be better to use images to carry the ideas. One picture is worth thousands of words.
But, here's the problem, when it comes to files export, the image gets blurred. When zooming in at presentation, it looks creepy at the contrast with clear topic lines and shapes.
Images on the website display perfectly on different tablets, from personal computer to mobile devices, not to even mention different tablets sizes.
Website and print graphics are often built in the SVG format, so they can be perfectly displayed on different tablets, from personal computer to mobile devices at different sizes. SVG file, known as scalable vector graphics, defines vector-based graphics in XML format.
It is resolution independent, so it can be scaled to different sizes without losing quality. So next time when inserting an icon, look for an SVG file so that file export can be clearer without losing a single resolution.
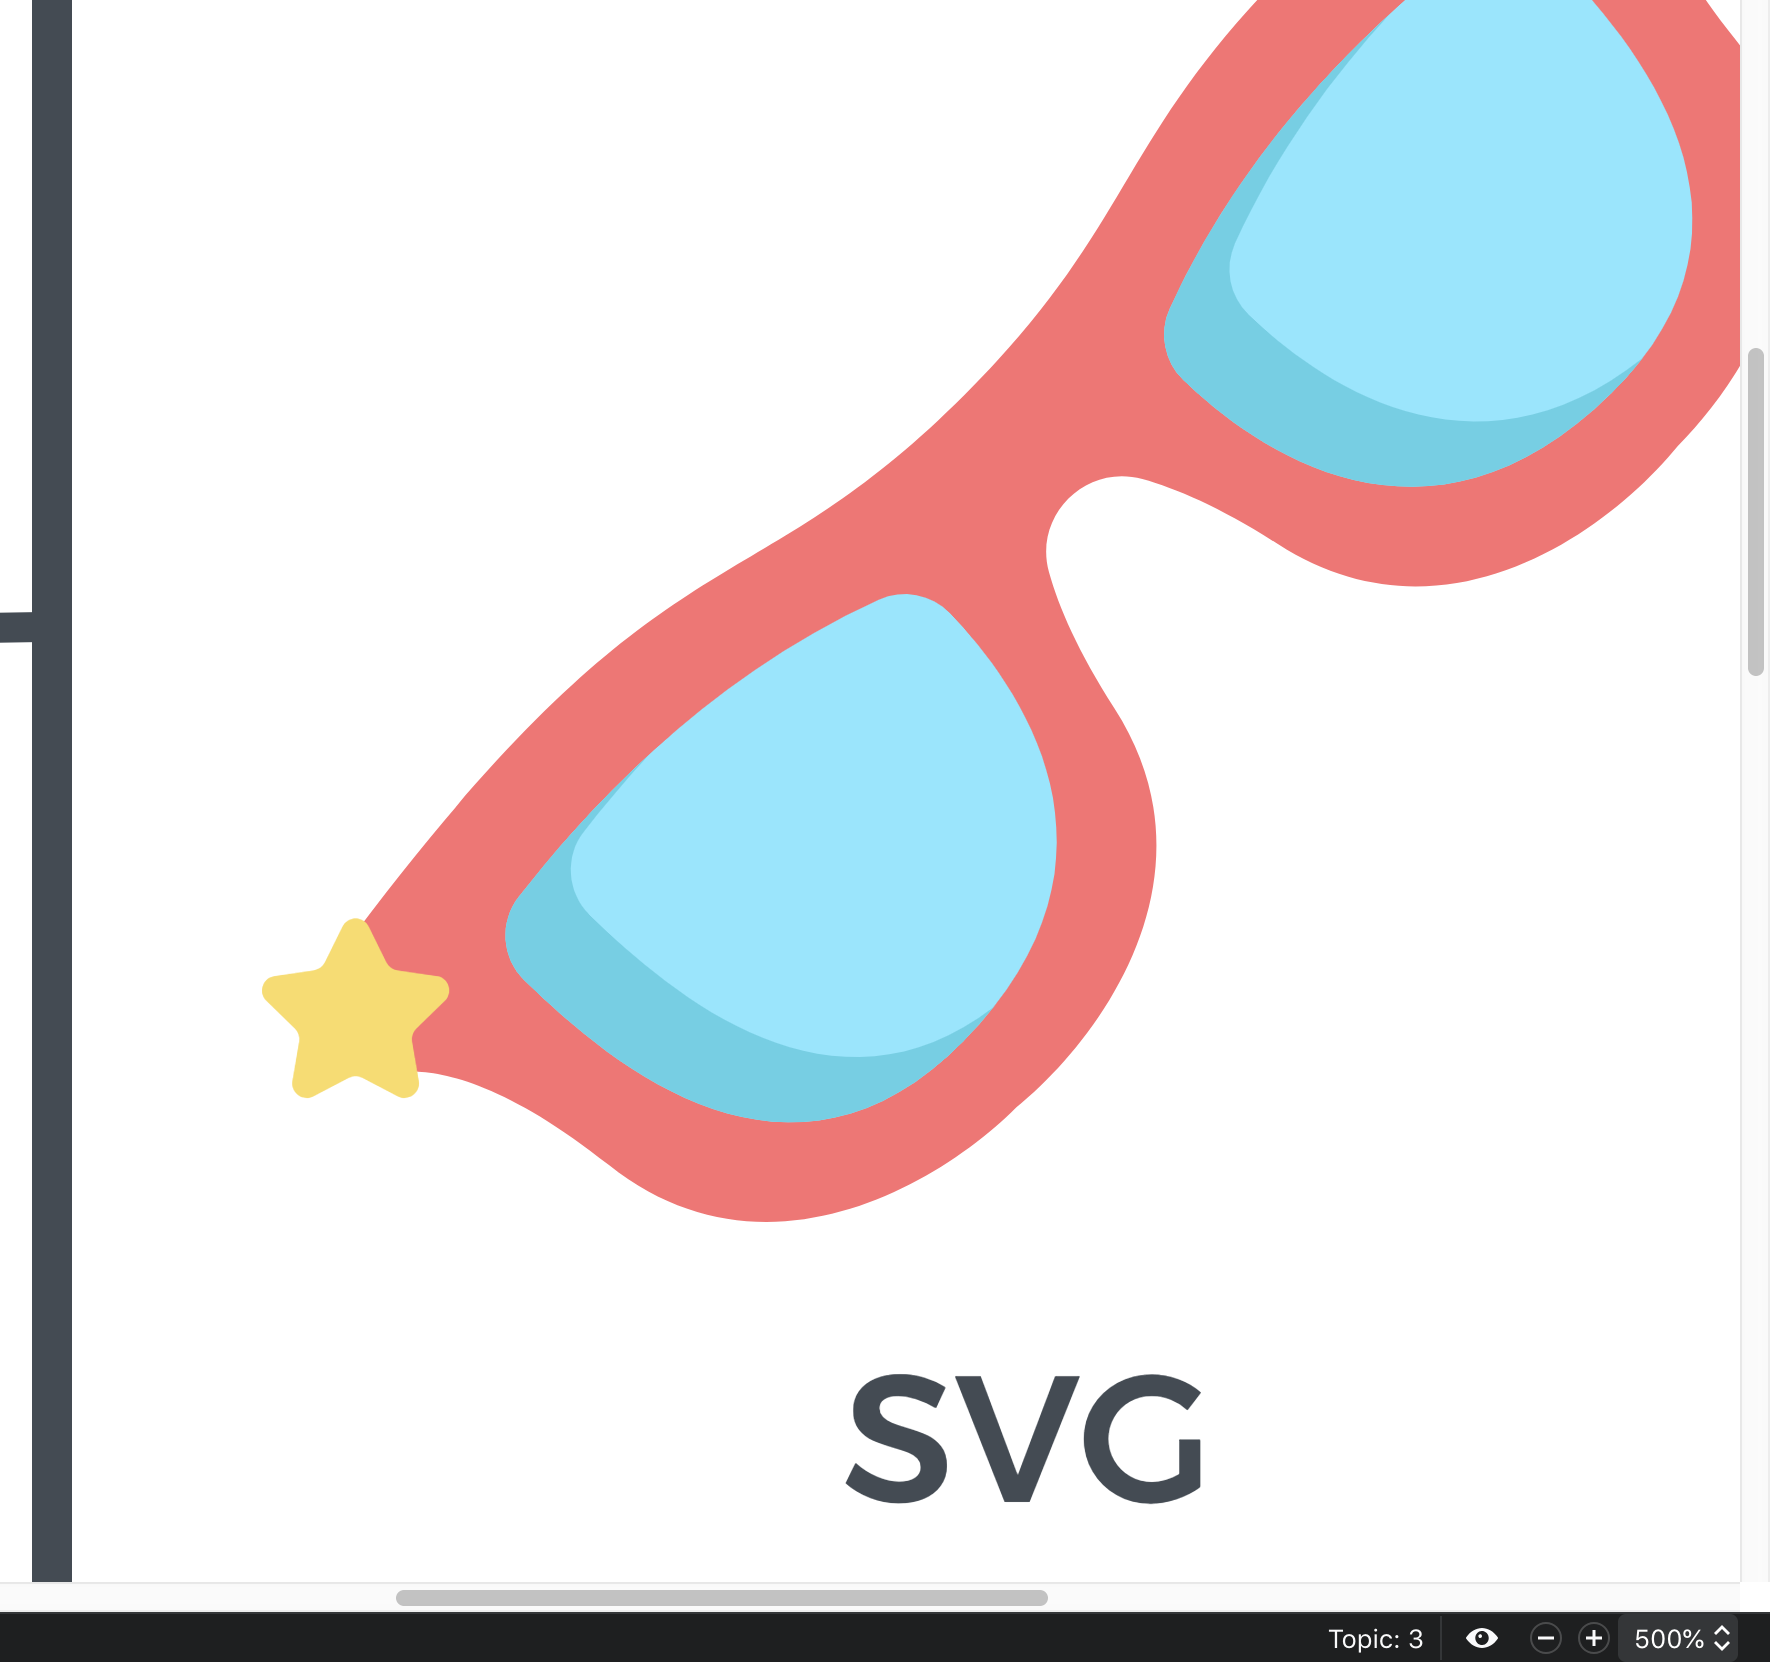
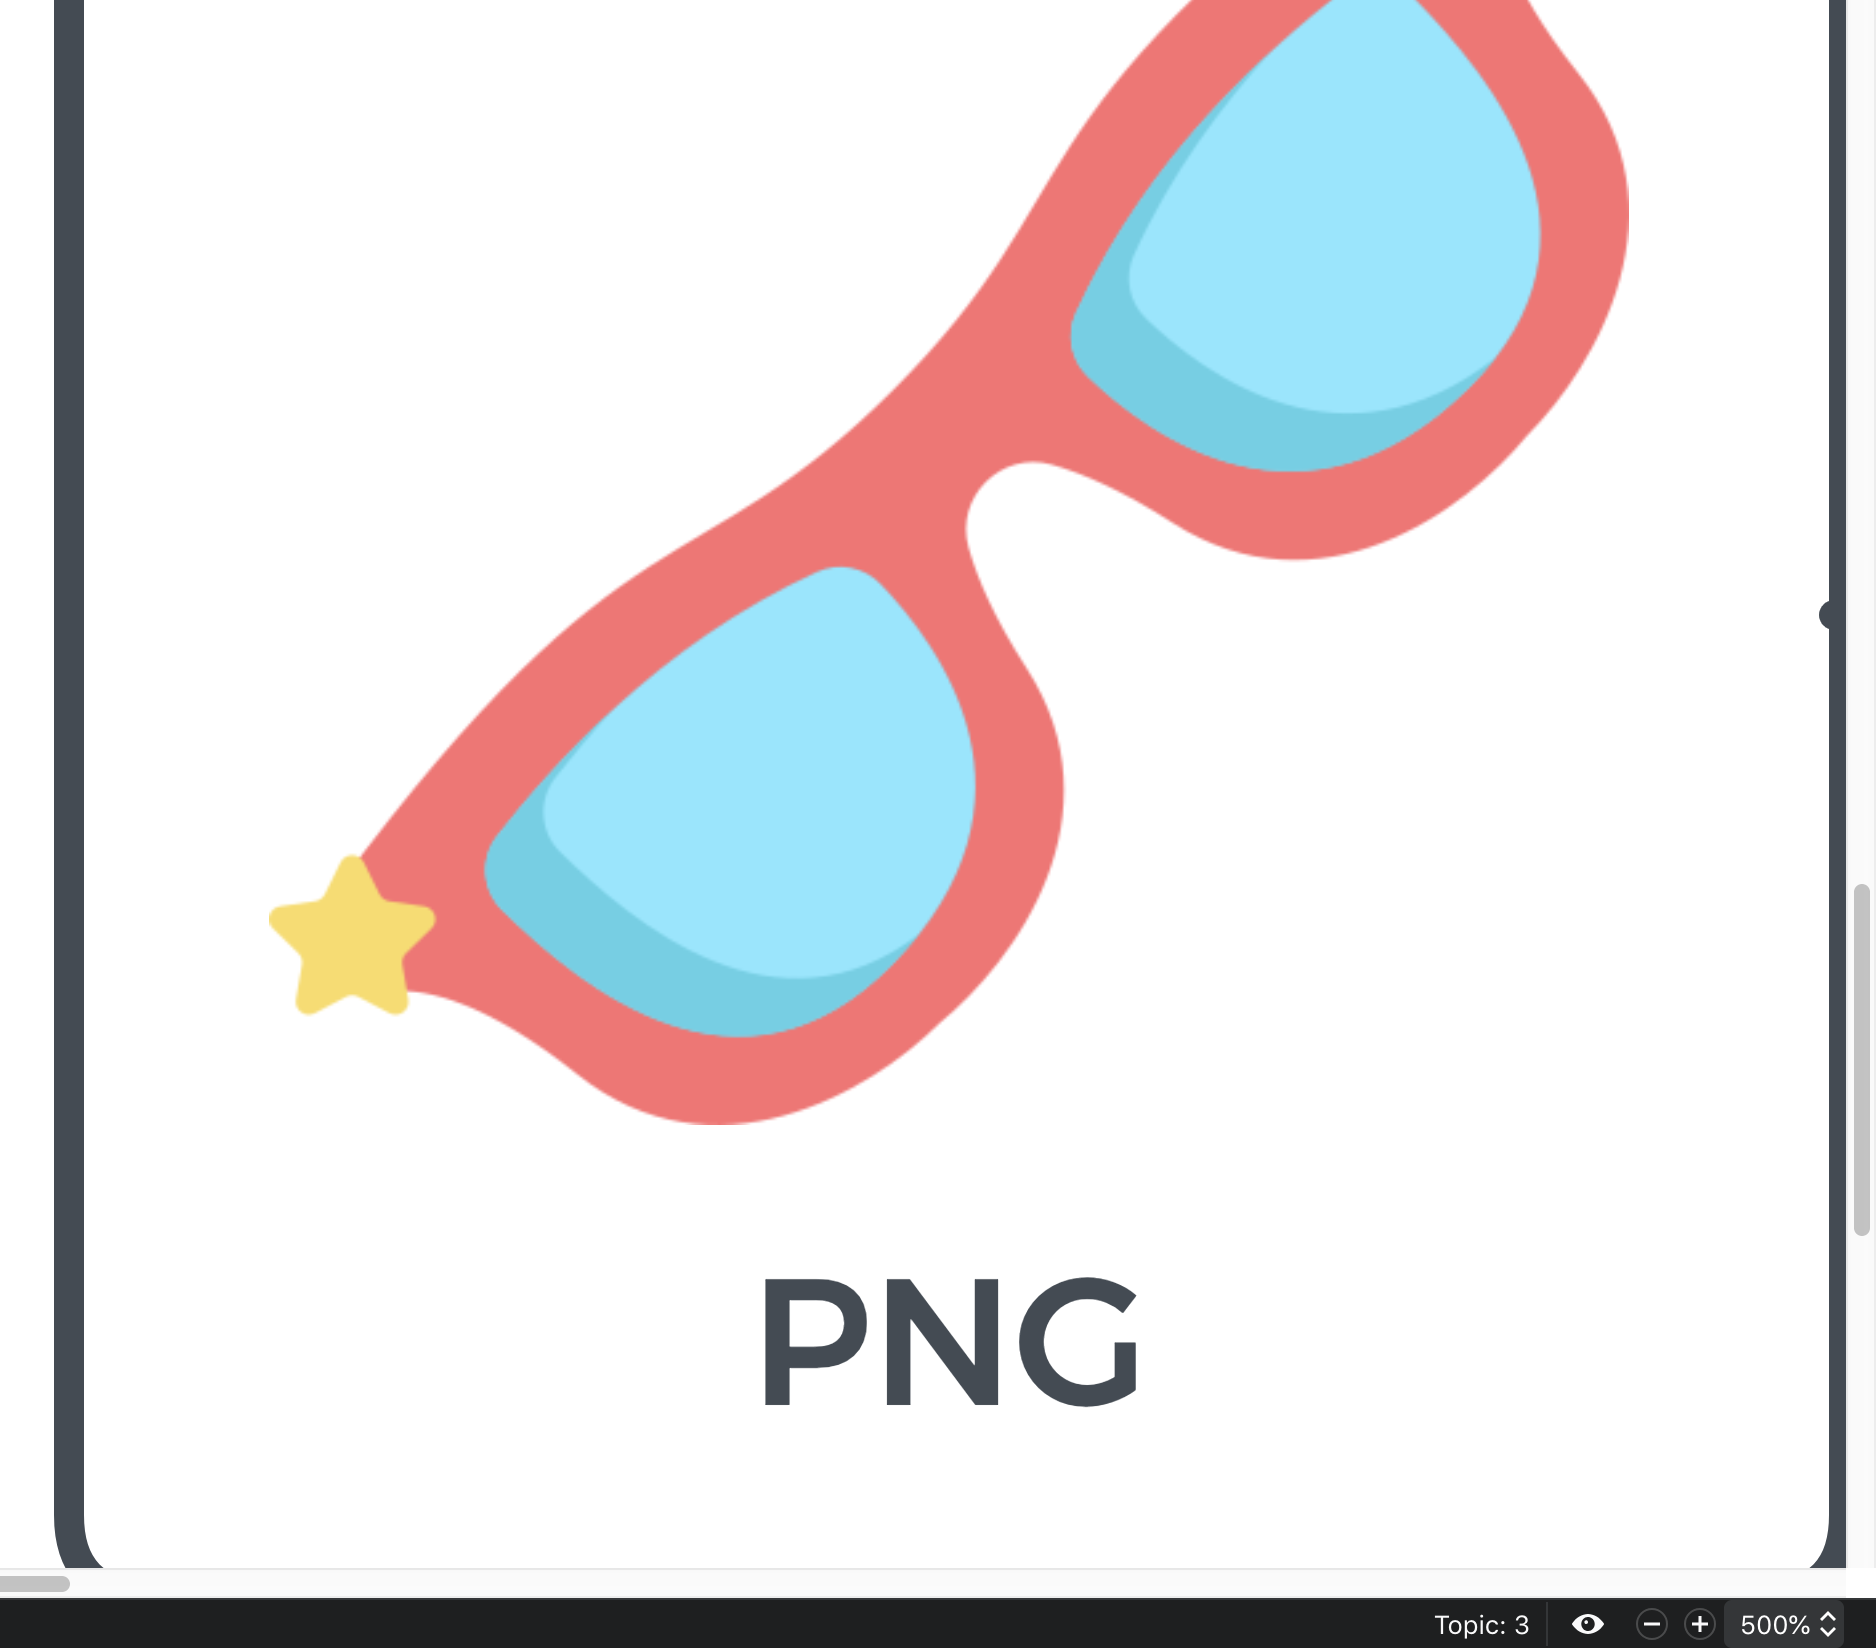
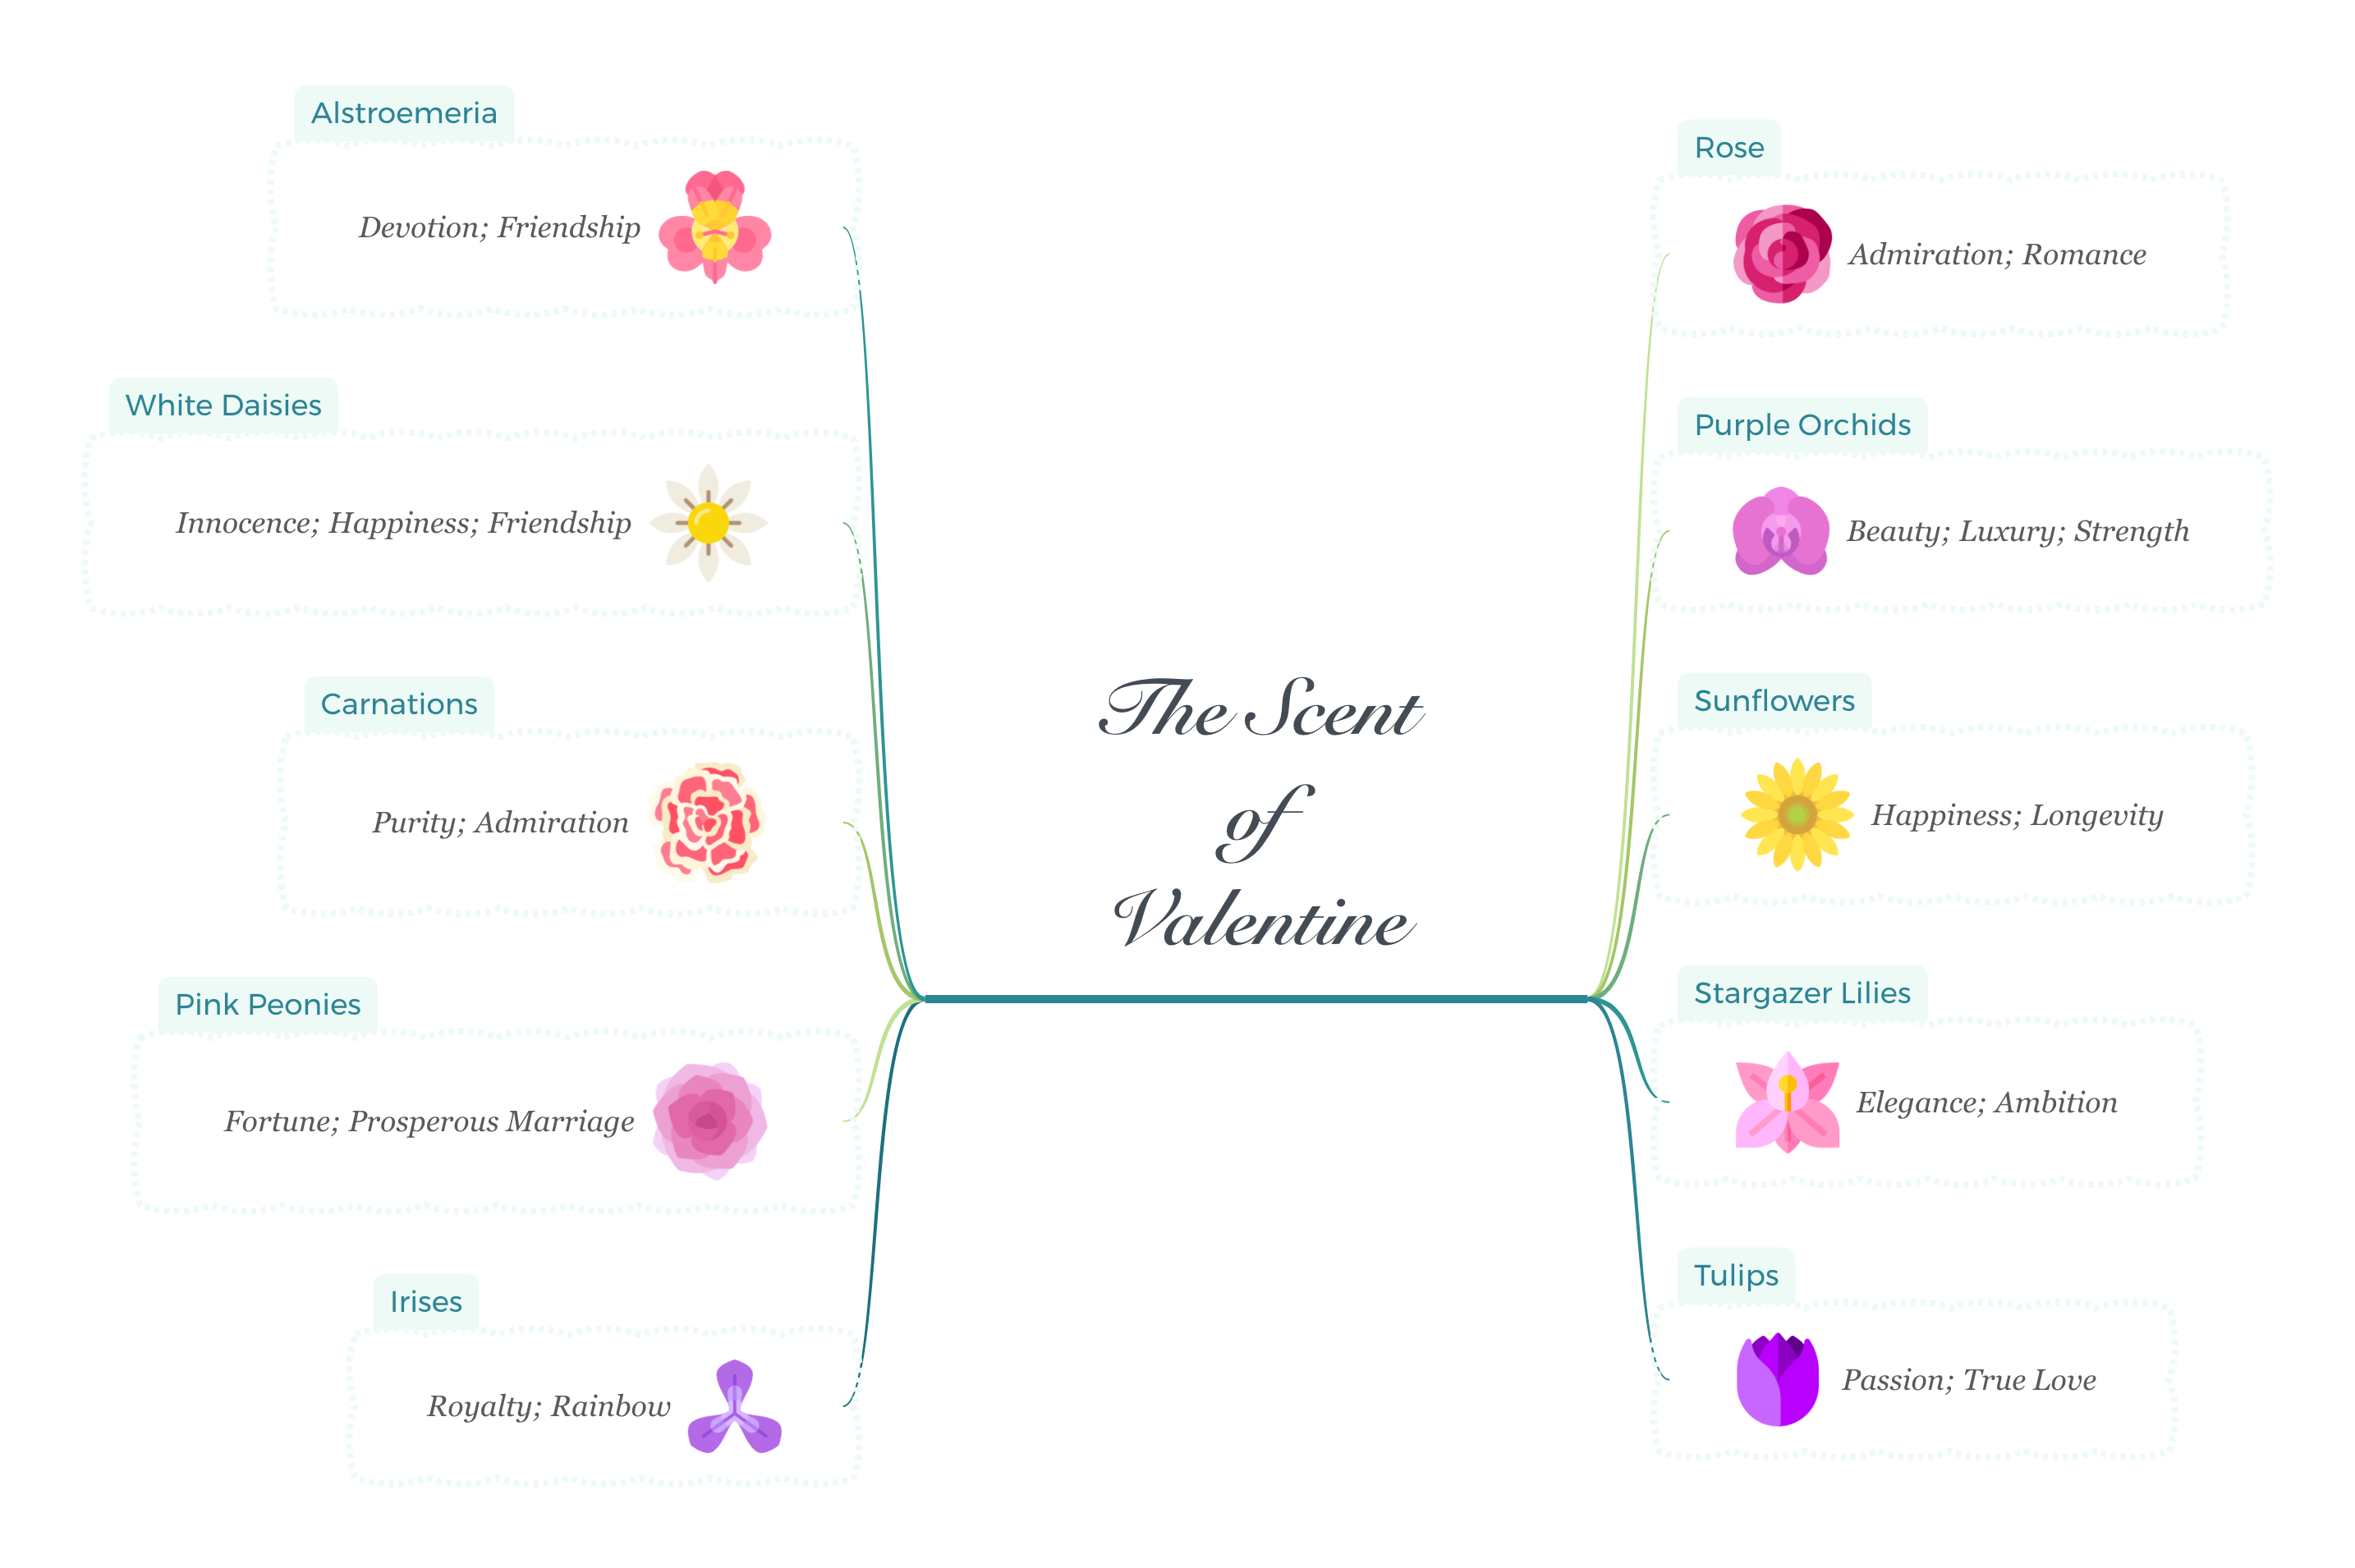
XMind: ZEN supports SVG file insert. Let’s look at the comparison with icons in PNG and SVG format below. Insert the same icons in different format into XMind: ZEN, and zoom in as 100%.
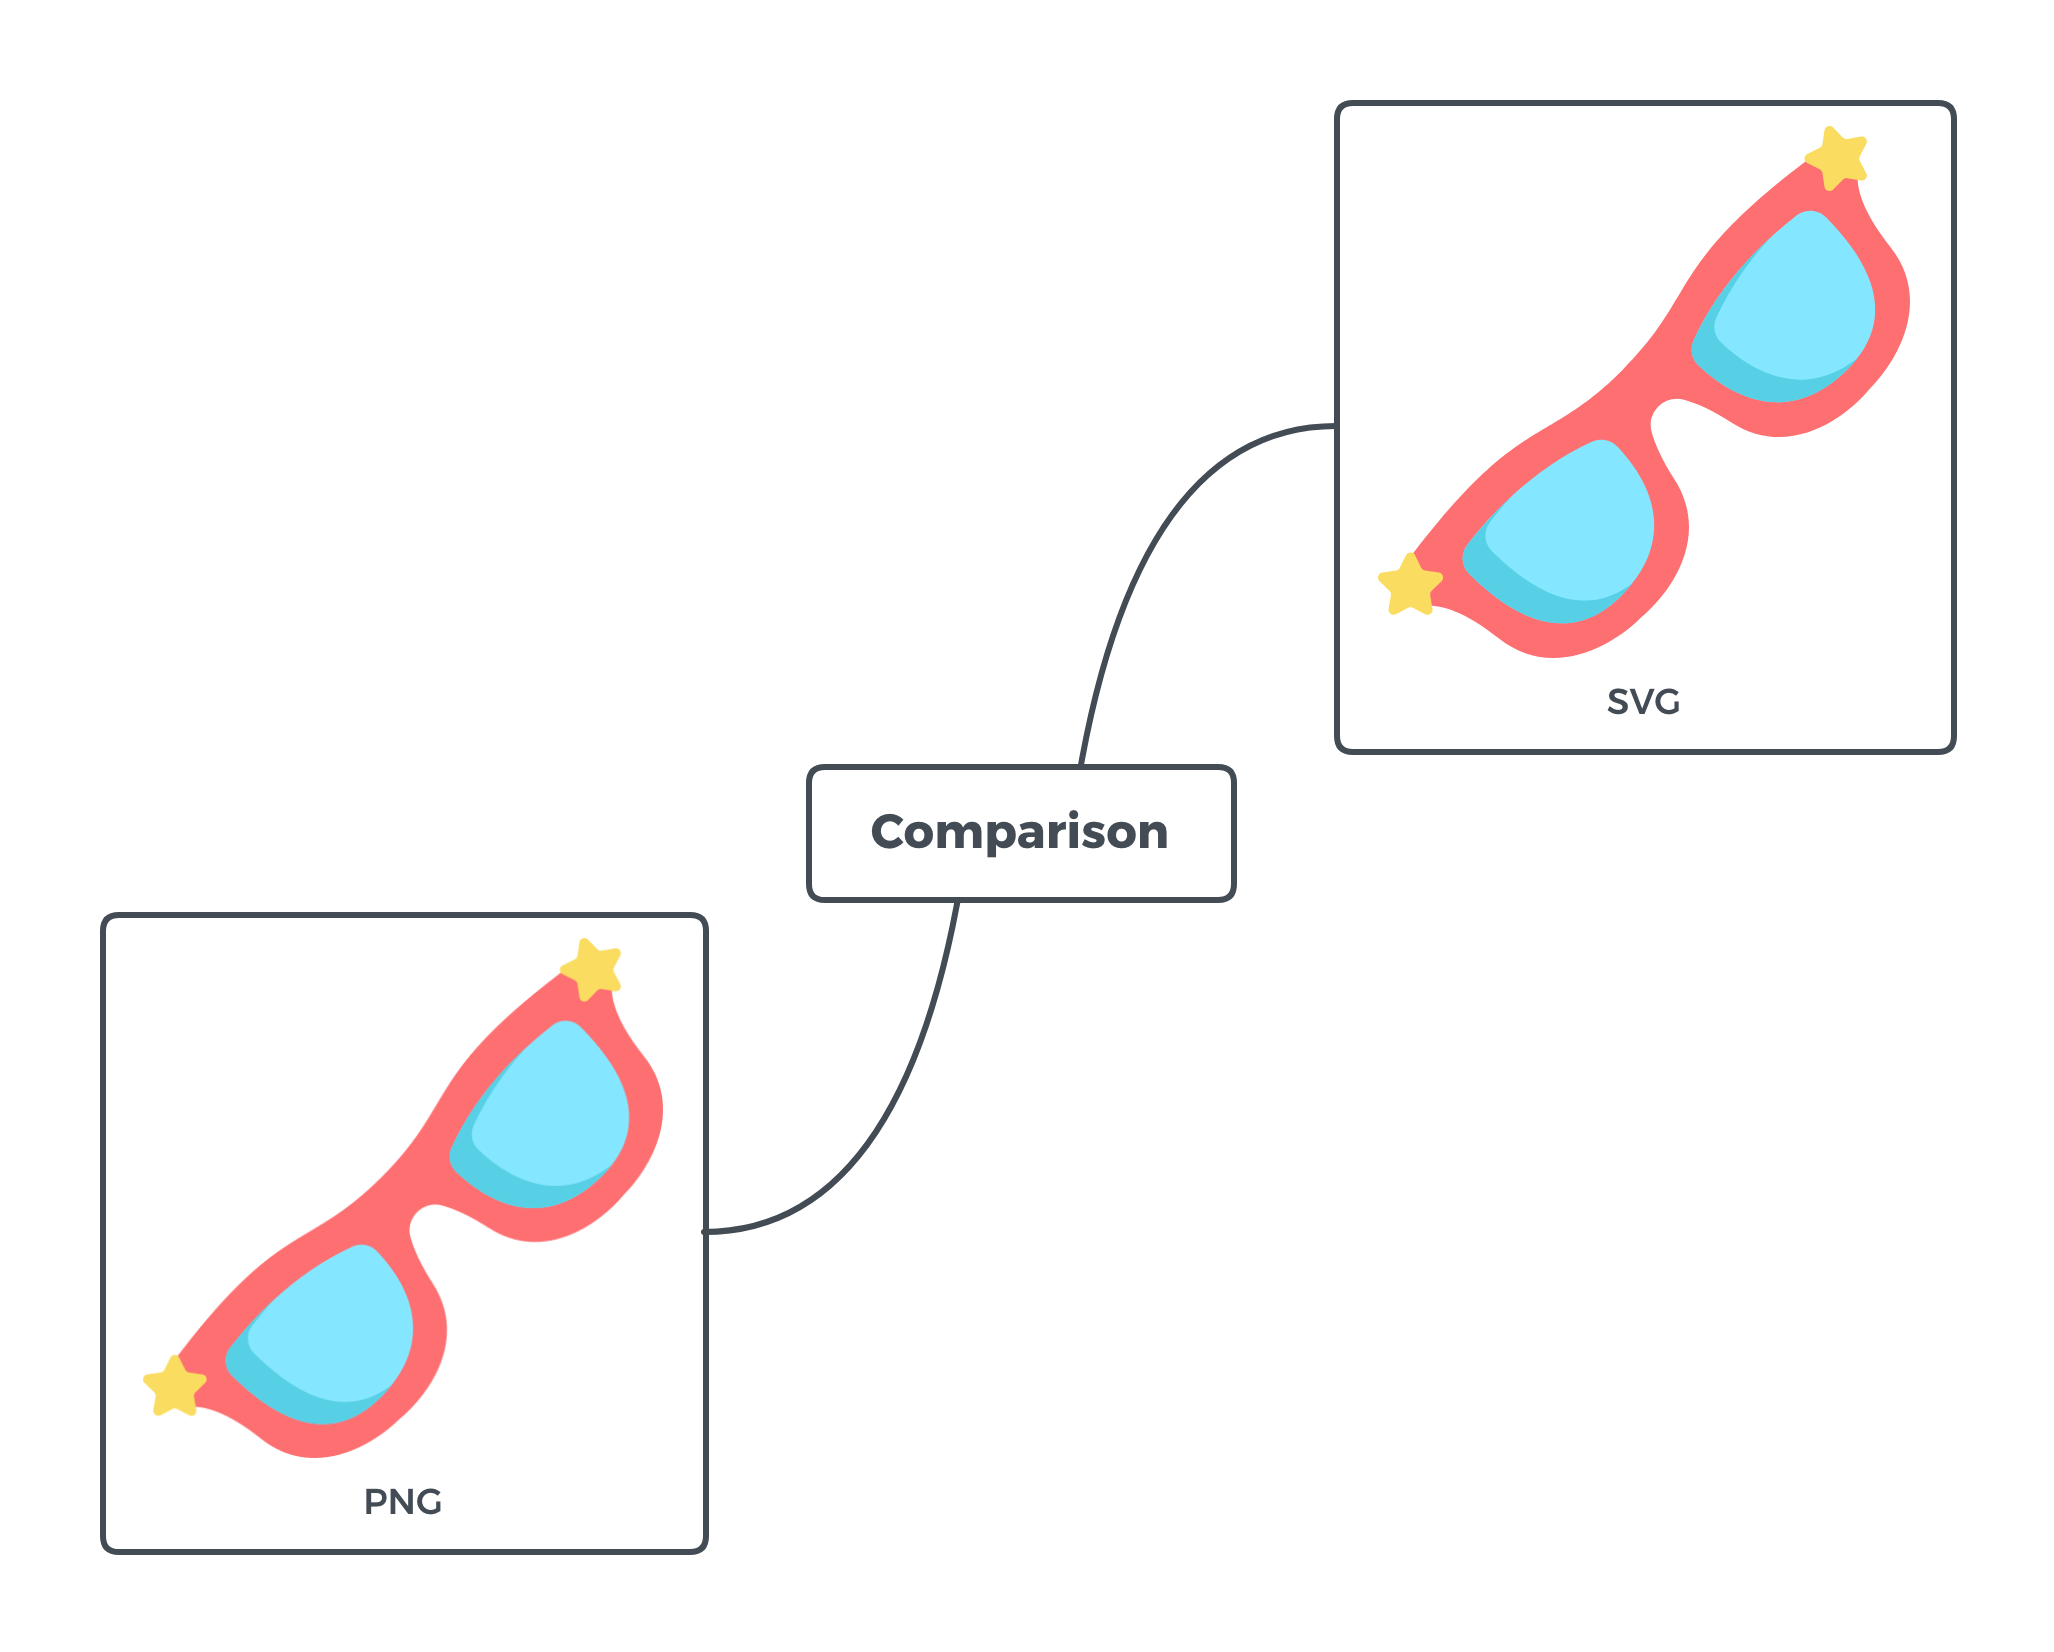
Then, zoom in the icon. You can see the icon in PNG format gets a little blur at the edge, while SVG format is still clear.
Now we’ve seen how powerful and stable SVG file is, and in fact, XMind: ZEN is also built in the SVG format, let's have a look how this duckling format turns mind mapping into a swam.
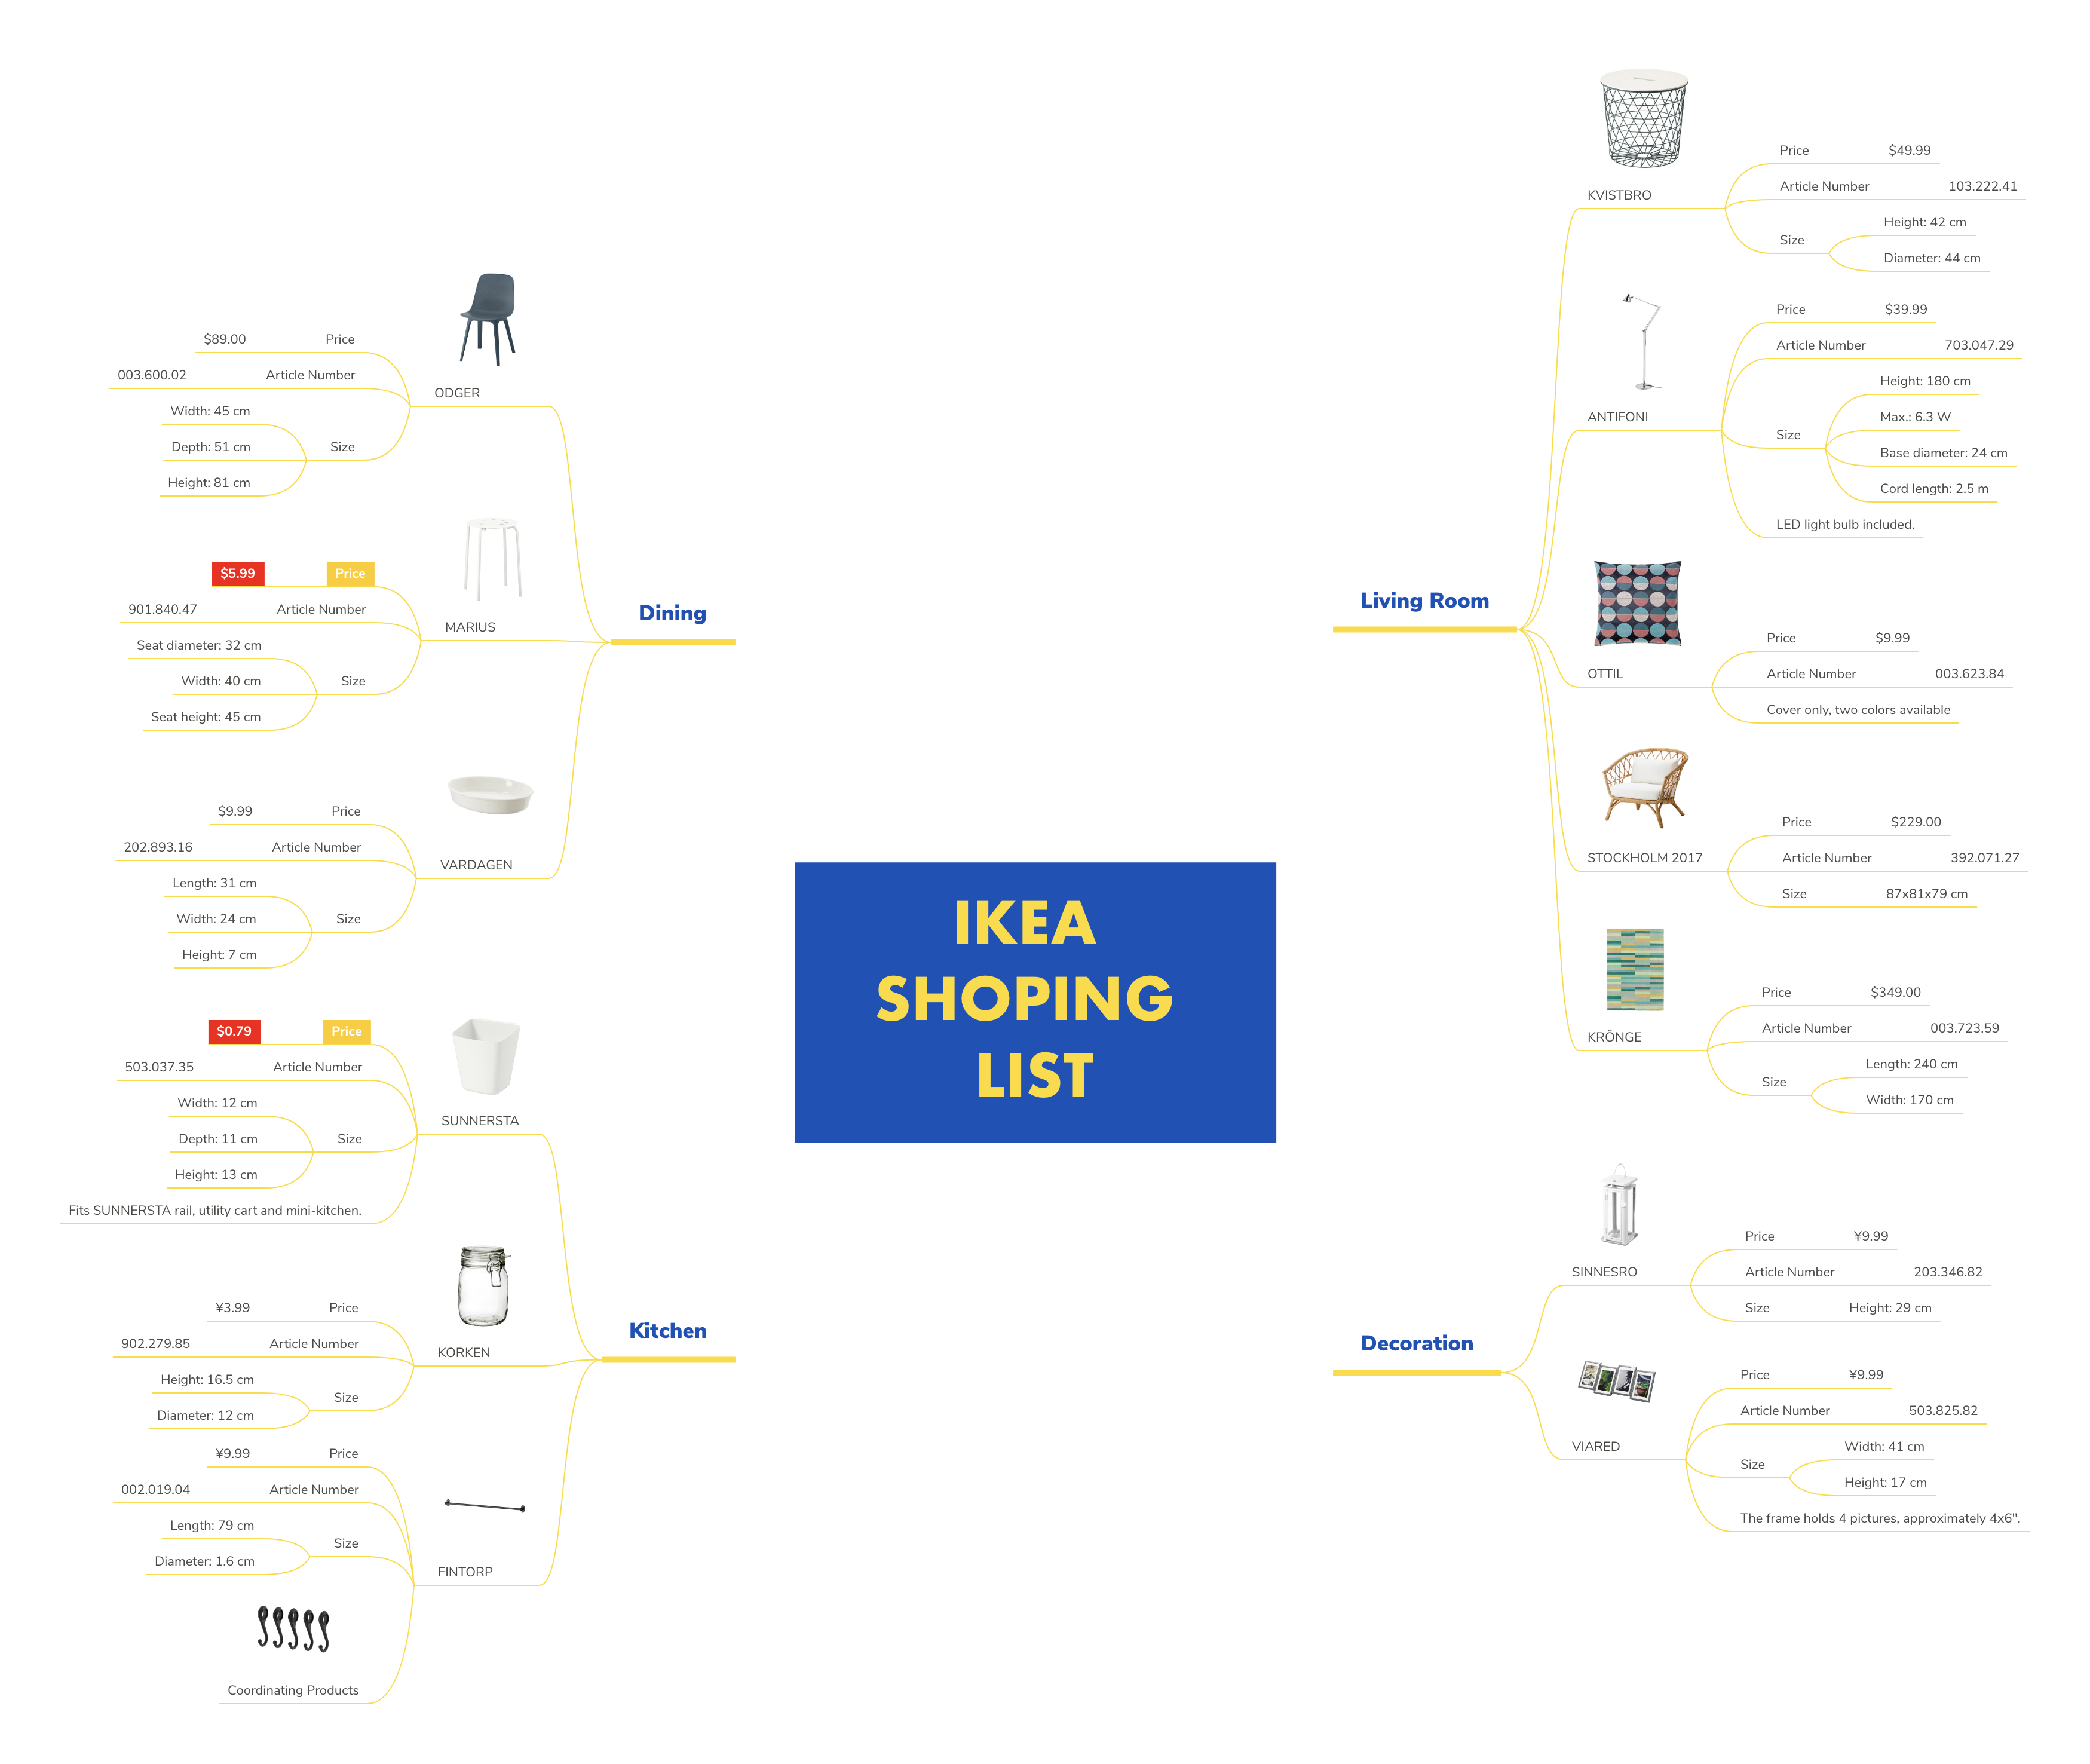
Shopping List with Items
Mind Map with Multiple Icons

Poster
SVG has an avalanche use cases in animations, interactivity, interfaces and applications building, etc. Start to implement SVG in mind maps, and graphics to make your work decent and clean.
More Posts
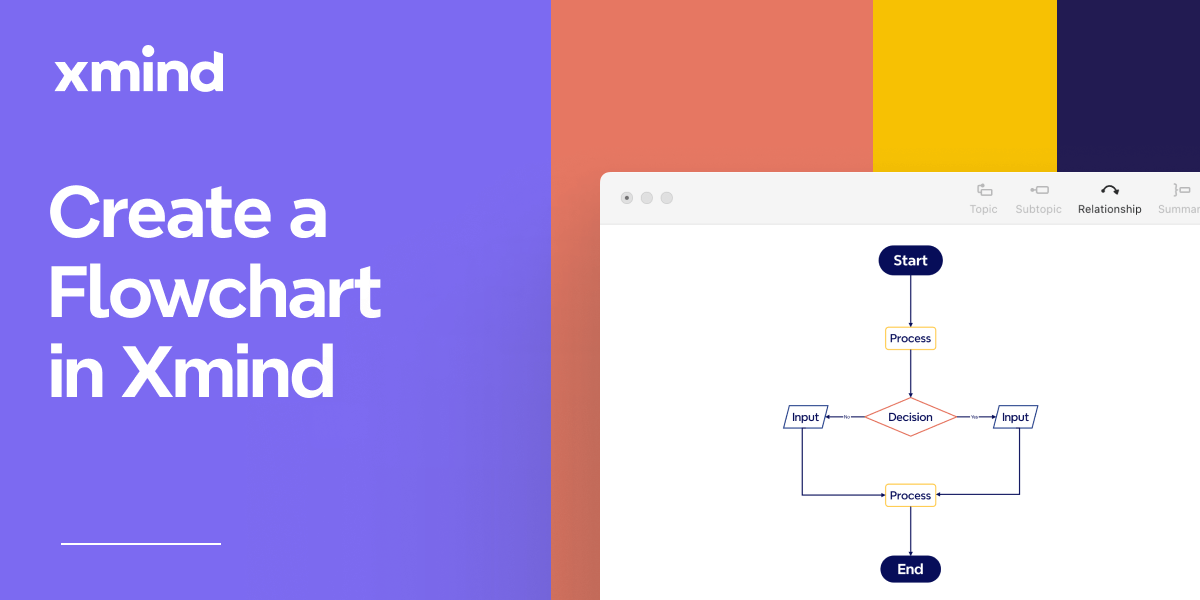
Flowchart Essentials: Definition, Templates, and Free Softwares
Discover the power of flowcharts with our detailed guide. Learn what a flowchart is, explore practical use cases, and discover how to create and optimize them using softwares like Xmind and Xmind AI for enhanced workflow efficiency.
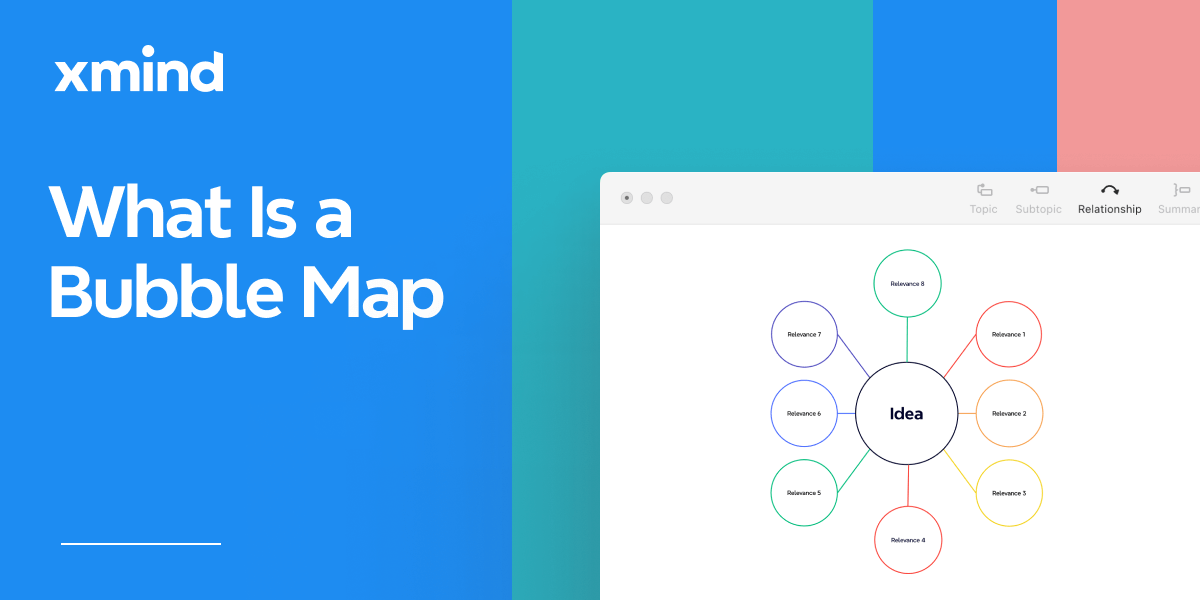
Bubble Maps: Definition, Examples, and How to Create in Xmind
Discover the power of bubble maps for data visualization with our comprehensive guide. Learn about different types, practical applications, and best mind mapping tools like Xmind. Get step-by-step instructions and expert tips to create stunning bubble maps for brainstorming, project management, and report writing.
The Complete Guide to Organizational Chart [2024]
Discover the simple steps to build dynamic organizational charts with Xmind.


One space for all your ideas
Organize thoughts, visualize structures, connect ideas, and unlock insights.
Get Started for Free